|
Miltenyi Biotec
surface antibody cd34 pe vio770 Surface Antibody Cd34 Pe Vio770, supplied by Miltenyi Biotec, used in various techniques. Bioz Stars score: 97/100, based on 1 PubMed citations. ZERO BIAS - scores, article reviews, protocol conditions and more https://www.bioz.com/result/surface antibody cd34 pe vio770/product/Miltenyi Biotec Average 97 stars, based on 1 article reviews
surface antibody cd34 pe vio770 - by Bioz Stars,
2026-03
97/100 stars
|
Buy from Supplier |
|
R&D Systems
anti human il 1β Anti Human Il 1β, supplied by R&D Systems, used in various techniques. Bioz Stars score: 95/100, based on 1 PubMed citations. ZERO BIAS - scores, article reviews, protocol conditions and more https://www.bioz.com/result/anti human il 1β/product/R&D Systems Average 95 stars, based on 1 article reviews
anti human il 1β - by Bioz Stars,
2026-03
95/100 stars
|
Buy from Supplier |
|
Cell Signaling Technology Inc
anti il 1β 3a6 mouse mab  Anti Il 1β 3a6 Mouse Mab, supplied by Cell Signaling Technology Inc, used in various techniques. Bioz Stars score: 98/100, based on 1 PubMed citations. ZERO BIAS - scores, article reviews, protocol conditions and more https://www.bioz.com/result/anti il 1β 3a6 mouse mab/product/Cell Signaling Technology Inc Average 98 stars, based on 1 article reviews
anti il 1β 3a6 mouse mab - by Bioz Stars,
2026-03
98/100 stars
|
Buy from Supplier |
|
Santa Cruz Biotechnology
rabbit anti-human p27 kip1 polyclonal antibody  Rabbit Anti Human P27 Kip1 Polyclonal Antibody, supplied by Santa Cruz Biotechnology, used in various techniques. Bioz Stars score: 90/100, based on 1 PubMed citations. ZERO BIAS - scores, article reviews, protocol conditions and more https://www.bioz.com/result/rabbit anti-human p27 kip1 polyclonal antibody/product/Santa Cruz Biotechnology Average 90 stars, based on 1 article reviews
rabbit anti-human p27 kip1 polyclonal antibody - by Bioz Stars,
2026-03
90/100 stars
|
Buy from Supplier |
|
R&D Systems
human il-1β (goat polyclonal antibody, 1:1000  Human Il 1β (Goat Polyclonal Antibody, 1:1000, supplied by R&D Systems, used in various techniques. Bioz Stars score: 90/100, based on 1 PubMed citations. ZERO BIAS - scores, article reviews, protocol conditions and more https://www.bioz.com/result/human il-1β (goat polyclonal antibody, 1:1000/product/R&D Systems Average 90 stars, based on 1 article reviews
human il-1β (goat polyclonal antibody, 1:1000 - by Bioz Stars,
2026-03
90/100 stars
|
Buy from Supplier |
|
Jackson Immuno
goat anti human igg Goat Anti Human Igg, supplied by Jackson Immuno, used in various techniques. Bioz Stars score: 93/100, based on 1 PubMed citations. ZERO BIAS - scores, article reviews, protocol conditions and more https://www.bioz.com/result/goat anti human igg/product/Jackson Immuno Average 93 stars, based on 1 article reviews
goat anti human igg - by Bioz Stars,
2026-03
93/100 stars
|
Buy from Supplier |
|
Cell Signaling Technology Inc
mouse anti mdm2  Mouse Anti Mdm2, supplied by Cell Signaling Technology Inc, used in various techniques. Bioz Stars score: 93/100, based on 1 PubMed citations. ZERO BIAS - scores, article reviews, protocol conditions and more https://www.bioz.com/result/mouse anti mdm2/product/Cell Signaling Technology Inc Average 93 stars, based on 1 article reviews
mouse anti mdm2 - by Bioz Stars,
2026-03
93/100 stars
|
Buy from Supplier |
|
Thermo Fisher
human sars-cov-2 spike (trimer) igg sandwich elisa kit Human Sars Cov 2 Spike (Trimer) Igg Sandwich Elisa Kit, supplied by Thermo Fisher, used in various techniques. Bioz Stars score: 90/100, based on 1 PubMed citations. ZERO BIAS - scores, article reviews, protocol conditions and more https://www.bioz.com/result/human sars-cov-2 spike (trimer) igg sandwich elisa kit/product/Thermo Fisher Average 90 stars, based on 1 article reviews
human sars-cov-2 spike (trimer) igg sandwich elisa kit - by Bioz Stars,
2026-03
90/100 stars
|
Buy from Supplier |
|
Boster Bio
human interleukin 1β Human Interleukin 1β, supplied by Boster Bio, used in various techniques. Bioz Stars score: 96/100, based on 1 PubMed citations. ZERO BIAS - scores, article reviews, protocol conditions and more https://www.bioz.com/result/human interleukin 1β/product/Boster Bio Average 96 stars, based on 1 article reviews
human interleukin 1β - by Bioz Stars,
2026-03
96/100 stars
|
Buy from Supplier |
|
Miltenyi Biotec
cd144 ve cadherin antibody Cd144 Ve Cadherin Antibody, supplied by Miltenyi Biotec, used in various techniques. Bioz Stars score: 95/100, based on 1 PubMed citations. ZERO BIAS - scores, article reviews, protocol conditions and more https://www.bioz.com/result/cd144 ve cadherin antibody/product/Miltenyi Biotec Average 95 stars, based on 1 article reviews
cd144 ve cadherin antibody - by Bioz Stars,
2026-03
95/100 stars
|
Buy from Supplier |
|
Miltenyi Biotec
anti cd31 microbeads Anti Cd31 Microbeads, supplied by Miltenyi Biotec, used in various techniques. Bioz Stars score: 99/100, based on 1 PubMed citations. ZERO BIAS - scores, article reviews, protocol conditions and more https://www.bioz.com/result/anti cd31 microbeads/product/Miltenyi Biotec Average 99 stars, based on 1 article reviews
anti cd31 microbeads - by Bioz Stars,
2026-03
99/100 stars
|
Buy from Supplier |
|
Miltenyi Biotec
anti lilra1 pe Anti Lilra1 Pe, supplied by Miltenyi Biotec, used in various techniques. Bioz Stars score: 94/100, based on 1 PubMed citations. ZERO BIAS - scores, article reviews, protocol conditions and more https://www.bioz.com/result/anti lilra1 pe/product/Miltenyi Biotec Average 94 stars, based on 1 article reviews
anti lilra1 pe - by Bioz Stars,
2026-03
94/100 stars
|
Buy from Supplier |
Image Search Results
Journal: Journal of Functional Foods
Article Title: Salidroside alleviates UVB-induced skin damage by inhibiting keratinocytes pyroptosis via the AQP3/ROS/GSDMD-N signaling pathway
doi: 10.1016/j.jff.2023.105647
Figure Lengend Snippet: Fig. 4. Salidroside (SAL) alleviates UVB induced inflammasome activation and reduces the release of inflammatory factors. (A) SAL inhibited the expressions of NLRP3, Caspase1, C-Caspase1 and GSDMD-N. (B) Concentration of IL-1β in supernatants of the culture media. (C) Concentration of IL-18 in supernatants of the culture media. All data were displayed as mean ± SEM, n = 5. *P < 0.05, **P < 0.01 versus group of UVB.
Article Snippet: The followings are the information of primary antibodies: rabbit anti-NLRP3 (Q96P20) mAb T55651 (1:1000, Abmart), rabbit anti-Caspase-1 (E9R2D) mAb #83383S (1:1000, CST), rabbit anti- C-Caspase-1 (Asp296) (E2G2I) Rabbit mAb #89332 (reactivity: mouse) (1:1000, CST), anti-C-Caspase-1 (Asp297) (D57A2) Rabbit mAb #4199(reactivity: human) (1:1000,CST), anti- Gasdermin D N terminal (P57764) (Q9D8T2) Rabbit mAb, PU224937(1:1000, abmart),
Techniques: Activation Assay, Concentration Assay

Journal: Journal of Functional Foods
Article Title: Salidroside alleviates UVB-induced skin damage by inhibiting keratinocytes pyroptosis via the AQP3/ROS/GSDMD-N signaling pathway
doi: 10.1016/j.jff.2023.105647
Figure Lengend Snippet: Fig. 5. Salidroside (SAL) suppresses pyroptosis via down-regulatin AQP3/ROS/GSDMD-N signaling pathway in HaCaT cell line. (A) The bands and analysis results of AQP3 expression in HaCaT cell line after the treatment of SAL. (B) The fluorescence results of the HaCaT cells with overexpression of AQP3. (C) The bands and analysis of AQP3 expression in HaCaT cell line after overexpression. (D) qPCR results of HaCaT with AQP3 overexpression and NC. (E) The concentration of H2O2 in cells. (F) The bands and analysis of Caspase1, C-Caspase1, NLRP3 and GSDMD-N after the overexpression of AQP3. (G) The concentration of IL-18 in cells after the overexpression of AQP3. (H) The concentration of IL-1β in cells after the overexpression of AQP3. (I) The level of ROS in cells after the overexpression of AQP3. (J) The inflammasomes in cells visualized by TEM. All data were displayed as mean ± SEM, n = 3. *P < 0.05, **P < 0.01 versus group of UVB; # P < 0.05, ##P < 0.01 versus group of AQP3+/+.
Article Snippet: The followings are the information of primary antibodies: rabbit anti-NLRP3 (Q96P20) mAb T55651 (1:1000, Abmart), rabbit anti-Caspase-1 (E9R2D) mAb #83383S (1:1000, CST), rabbit anti- C-Caspase-1 (Asp296) (E2G2I) Rabbit mAb #89332 (reactivity: mouse) (1:1000, CST), anti-C-Caspase-1 (Asp297) (D57A2) Rabbit mAb #4199(reactivity: human) (1:1000,CST), anti- Gasdermin D N terminal (P57764) (Q9D8T2) Rabbit mAb, PU224937(1:1000, abmart),
Techniques: Expressing, Fluorescence, Over Expression, Concentration Assay

Journal: Journal of Functional Foods
Article Title: Salidroside alleviates UVB-induced skin damage by inhibiting keratinocytes pyroptosis via the AQP3/ROS/GSDMD-N signaling pathway
doi: 10.1016/j.jff.2023.105647
Figure Lengend Snippet: Fig. 7. Salidroside (SAL) relieves UVB-induced oxidative damage and pyroptosis in mice (A) Immunohistochemical staining and analysis for AQP3. (B) The expression of AQP3 in the skin leision was dettected by Western blotting. (C) The concentrations of H2O2. (D) MDA, (E F) SOD, and GSH in skin lesions. (G) Immunohistochemistry staining and analysis for NLRP3. (H) The expressions of NLRP3, Caspase-1, C-Caspase-1, GSDMD-N, IL-1β and IL-18 were detected by Western blotting. All data were displayed as Mean ± SD, n = 3. *P < 0.05, **P < 0.01 versus group of UVB.
Article Snippet: The followings are the information of primary antibodies: rabbit anti-NLRP3 (Q96P20) mAb T55651 (1:1000, Abmart), rabbit anti-Caspase-1 (E9R2D) mAb #83383S (1:1000, CST), rabbit anti- C-Caspase-1 (Asp296) (E2G2I) Rabbit mAb #89332 (reactivity: mouse) (1:1000, CST), anti-C-Caspase-1 (Asp297) (D57A2) Rabbit mAb #4199(reactivity: human) (1:1000,CST), anti- Gasdermin D N terminal (P57764) (Q9D8T2) Rabbit mAb, PU224937(1:1000, abmart),
Techniques: Immunohistochemical staining, Staining, Expressing, Western Blot, Immunohistochemistry
Journal: bioRxiv
Article Title: Single-cell Landscape Analysis of the Circulating Human B Cell Pool under Selective Pressure of Allogeneic Stem Cell Transplantation
doi: 10.1101/2022.10.13.512162
Figure Lengend Snippet: A, DEGs in the scRNA-Seq dataset (untreated B cells) reaching significance ( P adj <0.05) in four or more of the 10 B cell clusters described in , being Up in Active cGVHD (left heat map) or Down in Active cGVHD (right heat map). Colored squares in the heat maps indicate the gene reached significance in that cluster, with log2 FC values as indicated. No DEGs mapped to Cluster 6. Genes that were also depicted in are shown in bold font. B, DEG analysis between disease groups performed on total untreated B cells. Heat maps show log2 FC values for annotated genes with a statistically different ( P adj <0.05) expression between allo-HCT patient groups, representing the difference in Active cGVHD B cells compared to No cGVHD B cells (Up or Down in Active cGVHD, as indicated). C-E, Validation of CKS2 transcript overexpression in Active cGVHD B cells within the scRNA-Seq dataset and for a different cohort of allo-HCT patients. In (C), normalized expression density UMAP plots for CKS2 from the single-cell RNA-Seq dataset in the Active cGVHD (Active) and No cGVHD (No) groups are shown. Representative regions depicted by the boxes were chosen randomly and enlarged (arrows) to visualize single B cells more easily. In (D), normalized CKS2 expression values across all 10 B cell clusters for all 8 allo-HCT patients are shown, separated by disease group. In (E), qPCR analysis of CKS2 was performed on freshly isolated, untreated B cells from a different allo-HCT patient cohort having Active cGVHD ( n =10) or No cGVHD ( n =7). Results indicate the fold change in CKS2 expression based on the mean value in the No cGVHD group normalized to 1. ACTB (β-ACTIN) was the housekeeping gene in the qPCR analysis. Statistical comparison was performed using a two-tailed Mann-Whitney test (GraphPad Prism 9 software; **, p <0.01). ( F ) Representative phosphoprotein capture arrays for detection of various intracellular signaling molecules phosphorylated on key sites involved in their regulatory activity, performed on whole cell lysates of purified, untreated B cells isolated from Active cGVHD ( n =3) and No cGVHD ( n =3) patient blood samples (see also fig. S6 ). Dashed boxes and protein IDs indicate the location and assay results for duplicate spots of capture antibodies against P27 KIP1 (phospho-T198), AMPKα2 (phospho-T172), and RSK1/2/3 (phospho-S380/S386/S377, respectively). Reference control spots on the arrays are indicated (ref). ( G ) Combined density results from the 3 independent phosphoprotein array assays shown in (F) and fig. S6 . Each bar indicates the results from one experiment and represents the ratio of the average dual spot intensity for Active cGVHD B cells over No cGVHD B cells for the protein indicated (dashed line represents a ratio of 1 as a guide). ( H ) Western blot analysis of total P27 KIP1 protein levels relative to β-ACTIN in whole cell lysates of B cells isolated from Active cGVHD ( n =4) and No cGVHD ( n =4) patient blood samples. Statistical comparisons were performed using a two-tailed, unpaired t-test (GraphPad Prism 9 software; **, p <0.01). ( I ) Model for P27 KIP1 dysregulation in Active cGVHD B cells.
Article Snippet: Membranes were blocked in 2% fish gelatin buffer for 75 min and then incubated with
Techniques: Expressing, Over Expression, RNA Sequencing Assay, Isolation, Two Tailed Test, MANN-WHITNEY, Software, Activity Assay, Purification, Western Blot
Journal: bioRxiv
Article Title: Caspase-4 dimerisation and D289 auto-processing elicits an interleukin-1β converting enzyme
doi: 10.1101/2023.01.05.522955
Figure Lengend Snippet: ( A ) Schematic of caspase-4 dimerisation with the DmrB system, which allows controlled dimerisation by AP20187 (AP). All DmrB constructs were N-terminally V5-tagged. ( B ) Schematic of band sizes generated by cleavage at D270 and D289. These putative cleavage sites were mutated (D→A) to prevent auto-processing. An IDL uncl construct encoding mutations at both D270 and D289 sites was also included. ( C ) Caspase-4 activity was measured by relative fluorescence (RFU) generated by Ac-WEHD-AFC substrate cleavage. Caspase-4 was expressed in HEK293T cells and incubated with AP for 30 min prior to Ac-WEHD-AFC cleavage experiment. Linear regression analysis ( D ) showing rate of Ac-WEHD-AFC cleavage. Data are mean ± SEM of three biological replicates. Each data point represents an individual donor. p ≤ 0.01 (**), p ≤ 0.001 (***), p ≤ 0.0001 (****). ( E ) Caspase-4 constructs were transfected in HEK293T cells and dimerised by AP. Auto-processing was analysed by western blot of cell extracts.
Article Snippet: Cell extracts and methanol/chloroform-precipitated supernatants were analysed by western blot using standard methods ( ) and the following reagents: antibodies against the caspase-4 large subunit (4B9, mouse monoclonal antibody, 1:1000; Santa Cruz Biotechnology),
Techniques: Construct, Generated, Activity Assay, Fluorescence, Incubation, Transfection, Western Blot
Journal: bioRxiv
Article Title: Caspase-4 dimerisation and D289 auto-processing elicits an interleukin-1β converting enzyme
doi: 10.1101/2023.01.05.522955
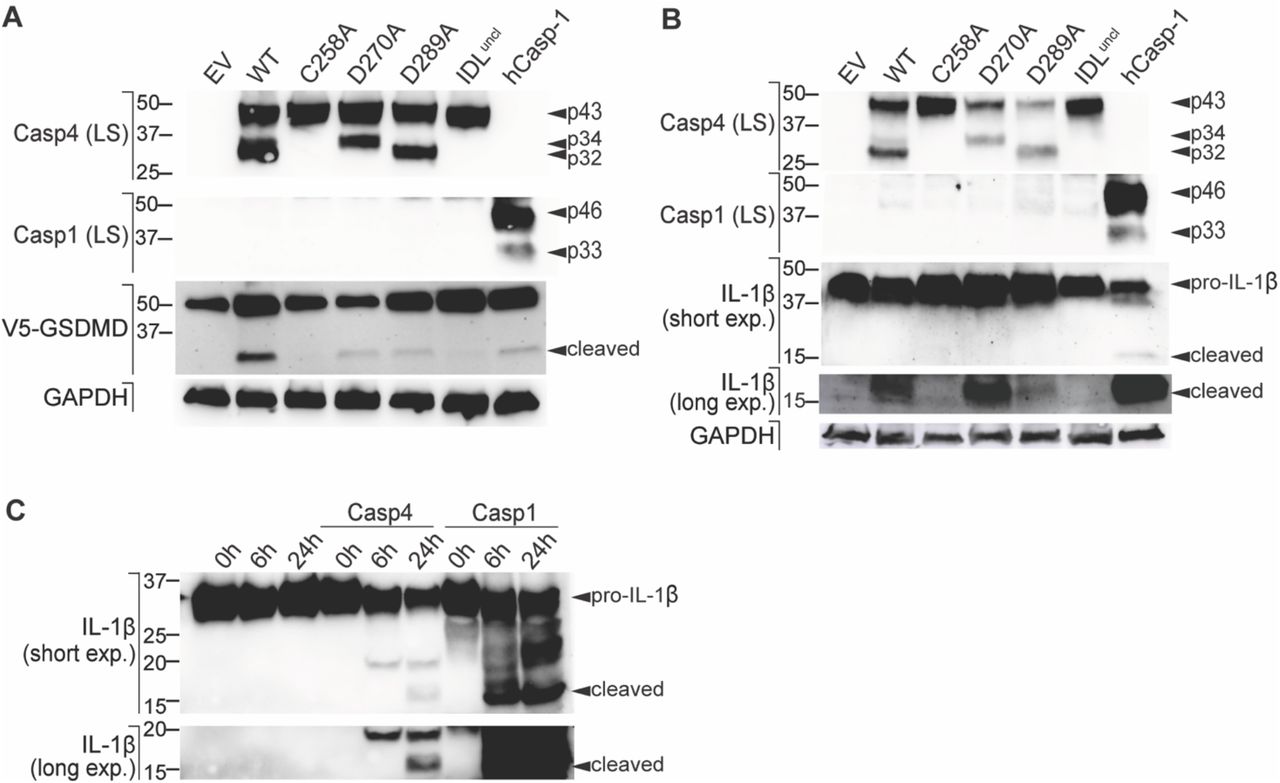
Figure Lengend Snippet: ( A - B ) Caspase-4 constructs were co-expressed with ( A ) V5-GSDMD or ( B ) pro-IL-1β in HEK293T cells and caspase-4 was dimerised by cell exposure to AP20187 (AP). Substrate cleavage was analysed by western blot of the whole cell lysates. ( C ) Recombinant caspase-4 or caspase-1 was incubated with recombinant human pro-IL-1β for 0 h, 6 h, and 24 h. All data ( A - C ) are representative of three biological replicates.
Article Snippet: Cell extracts and methanol/chloroform-precipitated supernatants were analysed by western blot using standard methods ( ) and the following reagents: antibodies against the caspase-4 large subunit (4B9, mouse monoclonal antibody, 1:1000; Santa Cruz Biotechnology),
Techniques: Construct, Western Blot, Recombinant, Incubation

Journal: bioRxiv
Article Title: Caspase-4 dimerisation and D289 auto-processing elicits an interleukin-1β converting enzyme
doi: 10.1101/2023.01.05.522955
Figure Lengend Snippet: ( A - C ) HMDMs were primed with extracellular K12 LPS (100 ng/mL) for 4 h, then either transfected with K12 LPS (10 μg/mL) using Lipofectamine LTX transfection reagent or 10 μM nigericin (Nig) was added to wells. VX-765 (10 μM) and MCC950 (10 μM) was added to cells 1 h before LPS transfection or nigericin treatment, then 4 h later, supernatants and cell lysates were collected. ( A ) Secretion of mature IL-1β into the supernatant was assessed by ELISA. ( B ) Cell death was assessed by quantifying lactate dehydrogenase (LDH) release into the supernatant, compared with full lysis (Triton X-100) control. Data ( A - B ) are the mean ± SEM of three biological replicates, and significance was assessed by unpaired t-test. Each data point represents an individual donor. p ≤ 0.01 (**), p ≤ 0.001 (***), p ≤ 0.0001 (****). ( C ) HMDMs were analysed by western blot of precipitated supernatant (SN) or cell lysate (XT). Western blots are representative of three biological replicates.
Article Snippet: Cell extracts and methanol/chloroform-precipitated supernatants were analysed by western blot using standard methods ( ) and the following reagents: antibodies against the caspase-4 large subunit (4B9, mouse monoclonal antibody, 1:1000; Santa Cruz Biotechnology),
Techniques: Transfection, Enzyme-linked Immunosorbent Assay, Lysis, Western Blot

Journal: bioRxiv
Article Title: Caspase-4 dimerisation and D289 auto-processing elicits an interleukin-1β converting enzyme
doi: 10.1101/2023.01.05.522955
Figure Lengend Snippet: NLRP3 mRNA expression levels were compared between untreated HBEC-KT cells and HMDMs ( A ). HBEC-KT cells were primed with extracellular K12 LPS (100 ng/mL) for 4 h ( B-D ), or HIEC-6 cells were primed with IFNγ (10 ng/mL) for 16 h ( E-F ). The cells were then either transfected with K12 LPS (10 μg/mL) using Lipofectamine LTX transfection reagent or 10 μM nigericin (Nig) was added to wells. VX-765 (10 μM) or MCC950 (10 μM) was added to cells 1 h before LPS transfection or nigericin treatment. Cell supernatants and cell lysates were collected 4 (HMDM and HBEC-KT) or 6 h (HIEC-6) later. Secretion of mature IL-1β into the supernatant was assessed by ELISA ( B, E ). Cell death was assessed by quantifying lactate dehydrogenase (LDH) release into the supernatant, compared with full lysis (Triton X-100) control ( C, F ). HBEC-KT lysates were analysed by western blot and are representative of three biological replicates ( D ). Data in ( A-C, F ) are the mean ± SEM of three biological replicates, and significance was assessed by unpaired t-test. Each data point represents an individual donor. p ≤ 0.01 (**), p ≤ 0.001 (***), p ≤ 0.0001 (****). Data in ( E ) are mean and technical triplicate, and are representative of three biological replicates.
Article Snippet: Cell extracts and methanol/chloroform-precipitated supernatants were analysed by western blot using standard methods ( ) and the following reagents: antibodies against the caspase-4 large subunit (4B9, mouse monoclonal antibody, 1:1000; Santa Cruz Biotechnology),
Techniques: Expressing, Transfection, Enzyme-linked Immunosorbent Assay, Lysis, Western Blot
Journal: bioRxiv
Article Title: A cross–nearest neighbor/Monte Carlo algorithm for single-molecule localization microscopy defines interactions between p53, Mdm2, and MEG3
doi: 10.1101/857912
Figure Lengend Snippet: MEG3 was induced by treatment of U2OS-MEG3 cells for 20 h with 1 μg/mL doxycycline and/or 10 μM nutlin-3a. Cells were stained for Mdm2 with a secondary antibody conjugated to ATTO 488 (green) and for p53 with a secondary antibody conjugated to Alexa Fluor 647 (magenta). From left to right: Merged image; RNA channel; p53 channel; dSTORM localization map; 30x inset of dSTORM localizations in the black box, with shaded circles indicating “molecules”. Scale bars are 10 μm, or 200 nm (right column).
Article Snippet: Primary antibodies (rabbit anti-p53 [7F5] (
Techniques: Staining

Journal: bioRxiv
Article Title: A cross–nearest neighbor/Monte Carlo algorithm for single-molecule localization microscopy defines interactions between p53, Mdm2, and MEG3
doi: 10.1101/857912
Figure Lengend Snippet: MEG3 was induced by treatment of U2OS-MEG3 cells for 20 h with or without 1 μg/mL doxycycline and/or 10 μM nutlin-3a. Cells were then fixed and stained for 2-color dSTORM of p53 and Mdm2. For each condition, single molecule localizations were collected from 10 randomly chosen cells in 3 separate experiments. (A) Fraction of pairs associated, as defined by a probability of chance association < 0.1 (i.e., correction for local density) and distance < 200 nm (upper limit for binding distance, accounting for error). (B) Median distance between pairs for each cell (nm). Boxes indicate median +/- upper and lower quartile; whiskers indicate the range excluding outliers. Data points are colored by replicate. Means for each replicate are indicated by same-colored squares. * indicates p < 0.05 by ANOVA.
Article Snippet: Primary antibodies (rabbit anti-p53 [7F5] (
Techniques: Staining, Binding Assay